← Back

Indicators

Custom TradingView indicators. Free to copy.

Indicators2
Pine versionv5 and v6
MarketsCrypto, stocks, commodities
TimeframeWeekly

Moons Bottom

Overlay Pine v6 Best on weekly Crypto, stocks, commodities

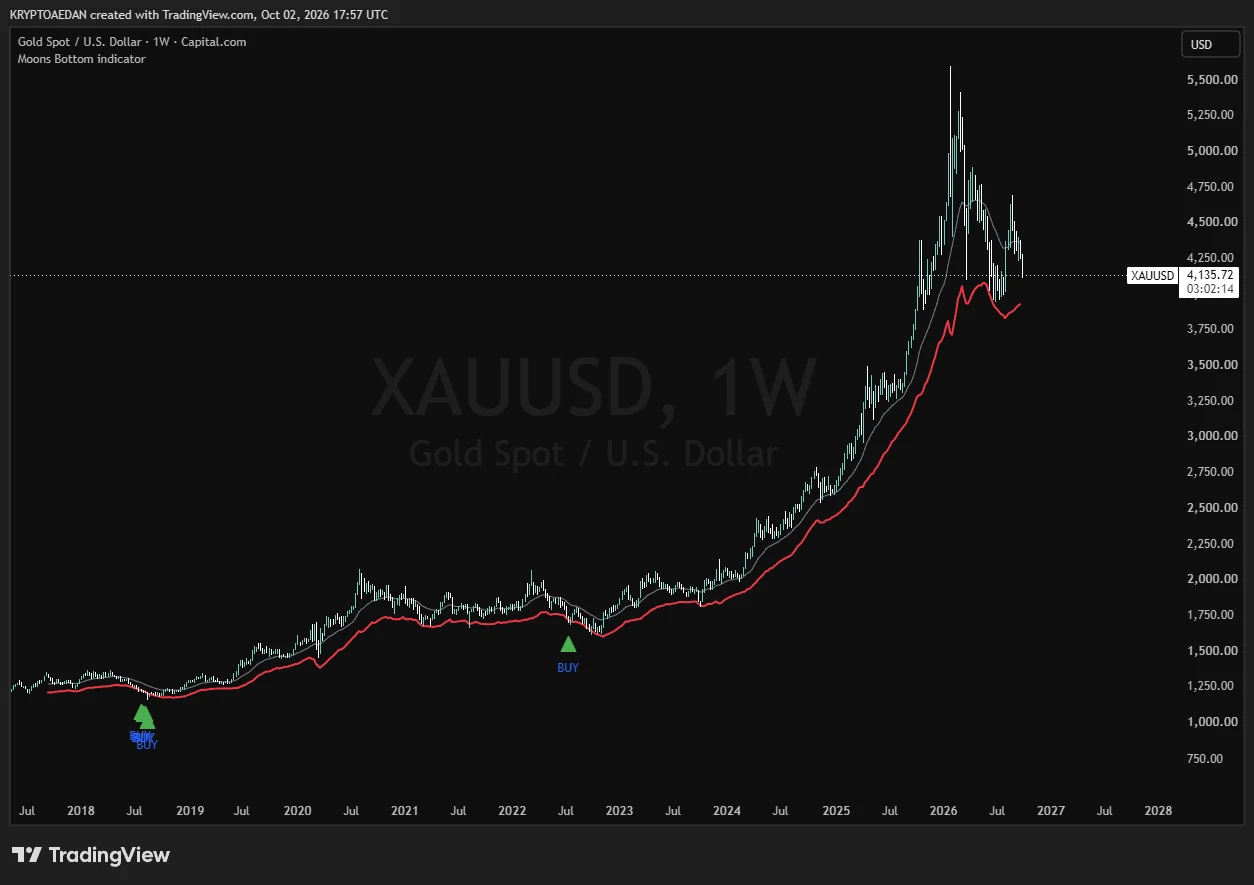
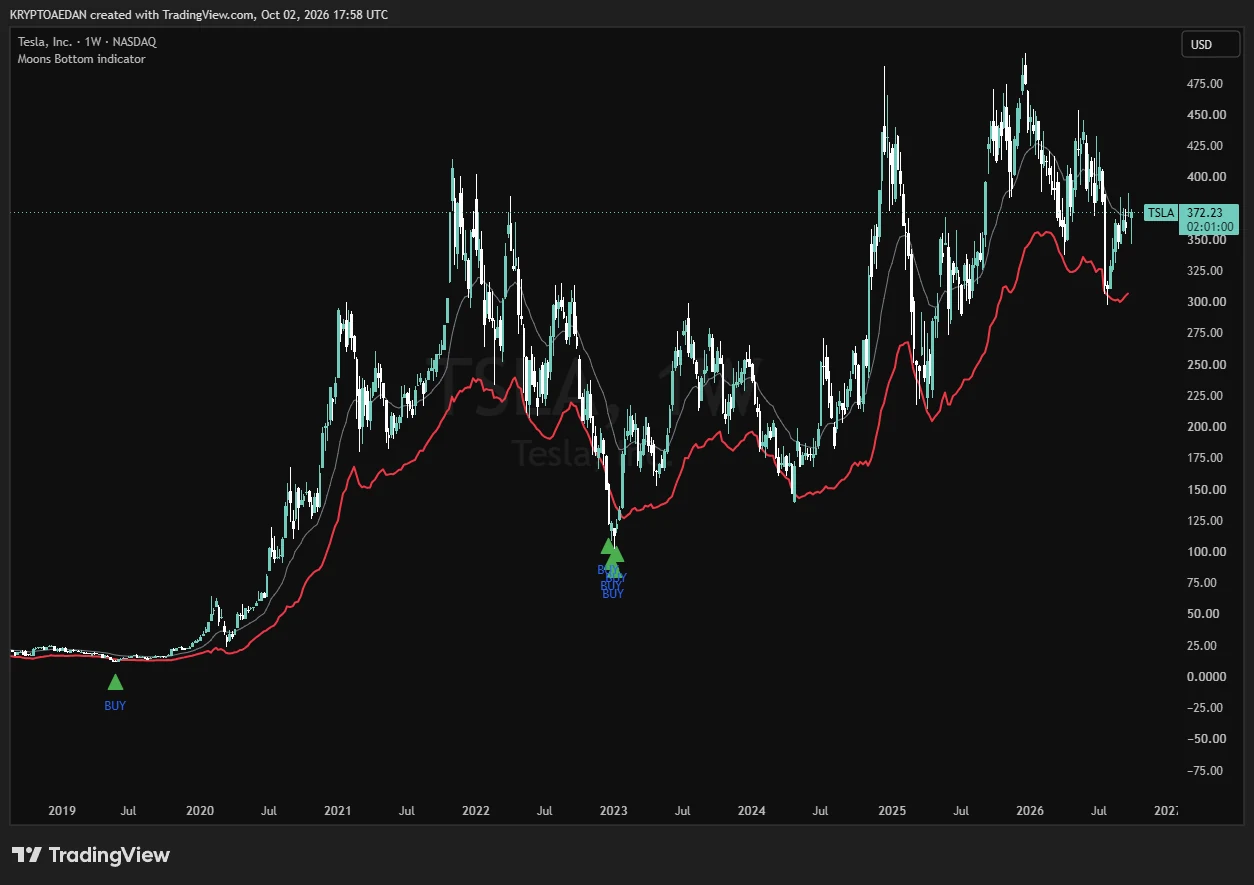
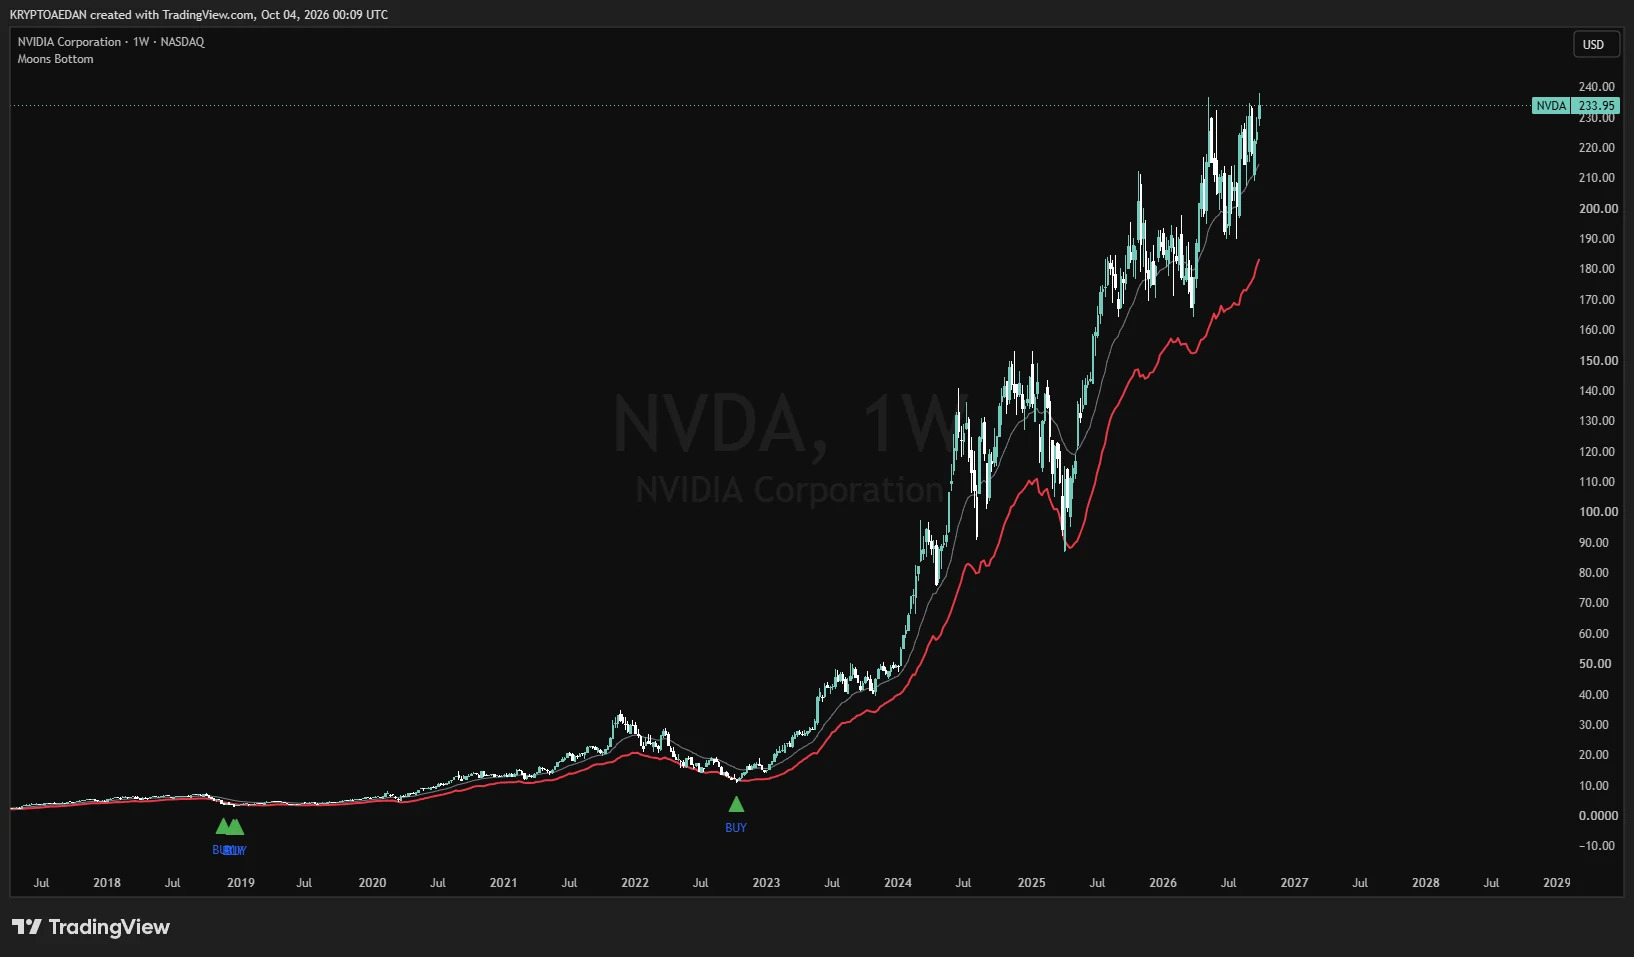
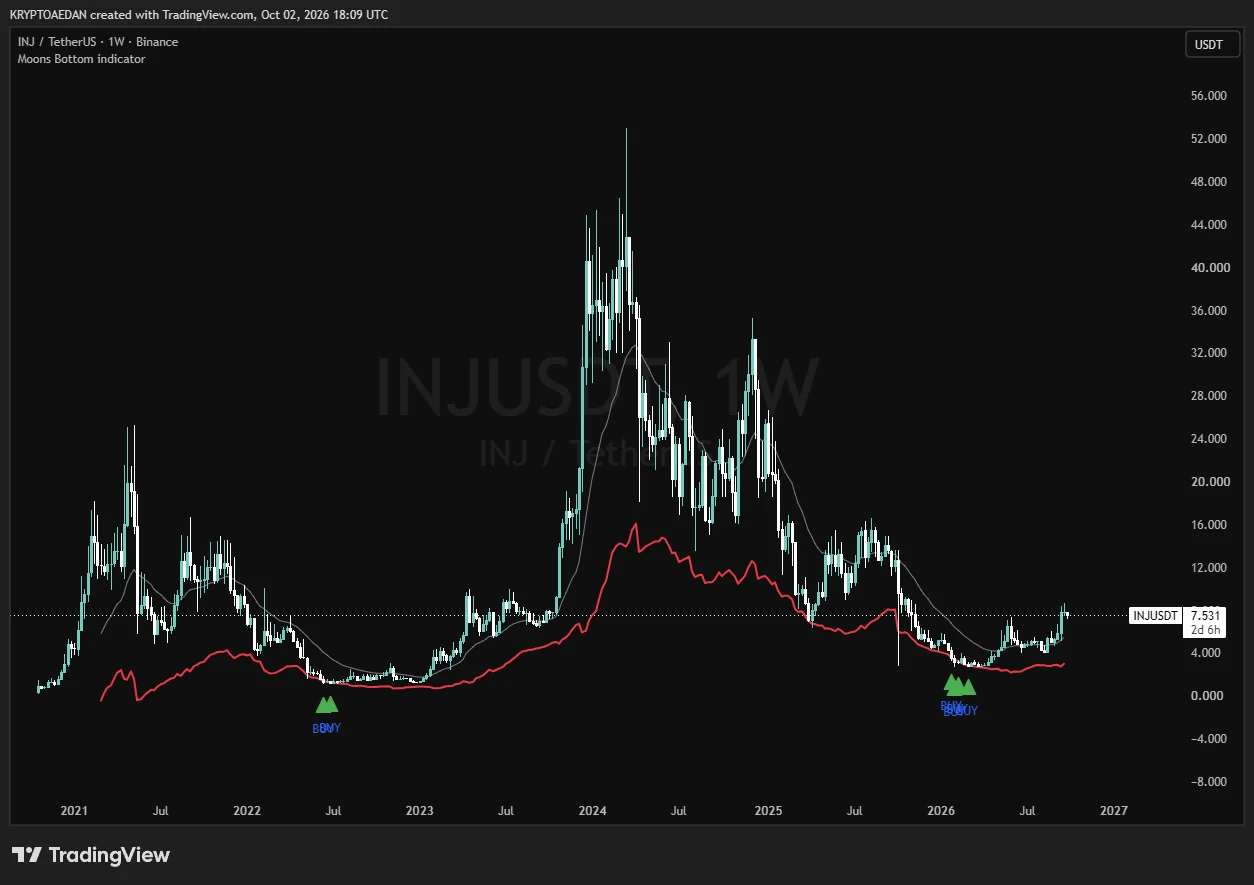
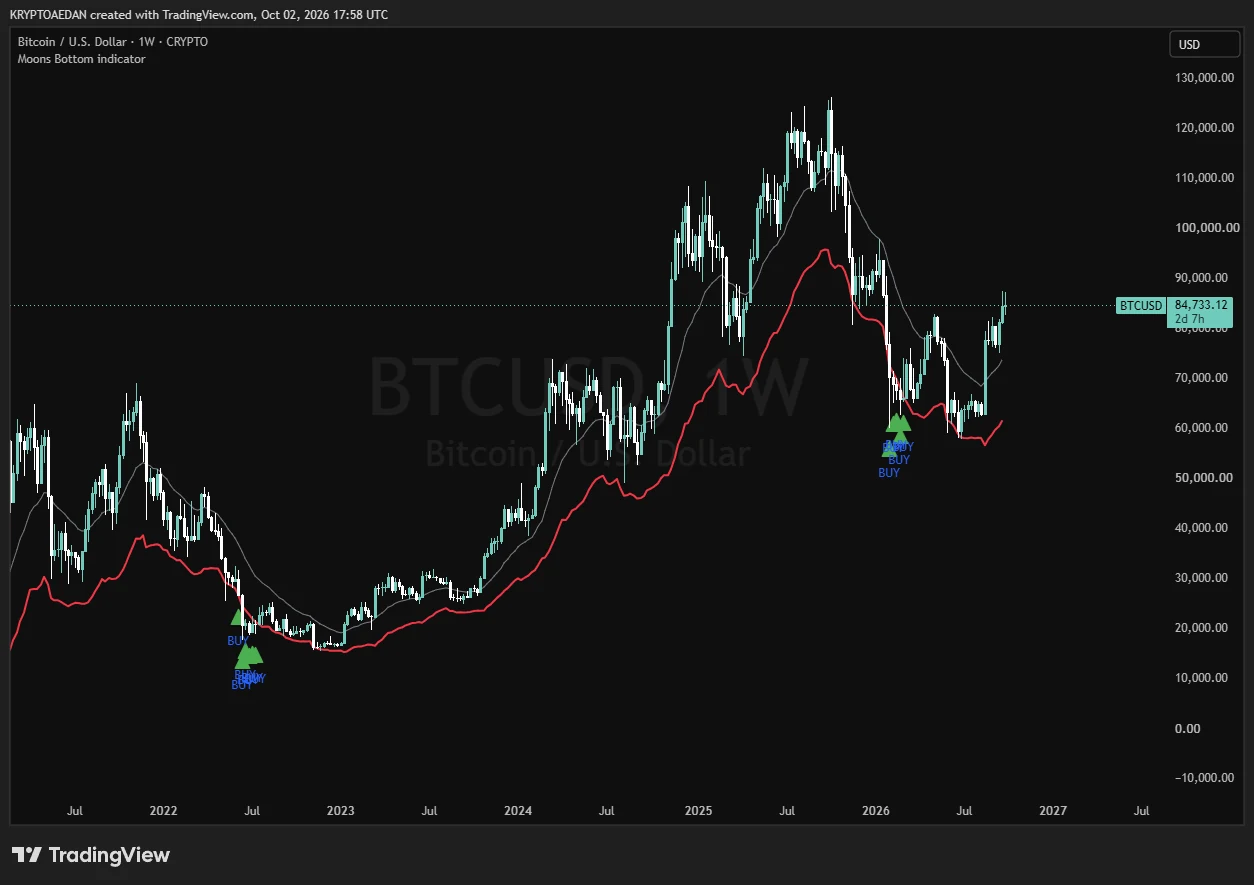
Spots washed-out bottoms. A green BUY prints when price is stretched far below its average and selling is exhausted.
Open TradingView
What it does
  • Plots a gray 20 EMA as the "mean" price and a red lower boundary below it.
  • Prints a green BUY triangle under a candle when price closes below the red line and short-term RSI is deeply oversold.
  • Only looks for bottoms. It gives no sell or exit signal.
How it works

The red line is a Keltner lower band: the 20 EMA minus 2 times the ATR (average true range, a measure of how far price normally moves). A close below it means price is stretched further under its average than normal volatility explains.

The second filter is a fast RSI (7 periods, smoothed with a 3-period EMA) dropping under 25, which means the recent selling has been relentless.

A BUY prints only when both are true on the same candle. Requiring both matters. Price below the band alone happens in any downtrend, and low RSI alone can sit low for a long time. Together they describe a washout: a fast drop that is stretched and out of steam, which is when buyers tend to step in and price snaps back toward the mean.

Why weekly

This is built for the weekly chart. A weekly candle is a full week of buying and selling, so one bad day or a wick doesn't trigger it. A weekly close below the red line is a much bigger stretch than a daily one, and a 7-period RSI on weekly covers seven weeks of momentum. The result is far fewer signals and far less noise.

  • Weekly: fewer, cleaner signals. This is where it's most accurate.
  • Markets: it works on crypto, stocks and commodities when used on weekly.
  • Lower timeframes: daily and below still work, but you get many more signals and more false ones, so expect to filter them yourself.
How to read it
  • A green BUY triangle means the stretch and oversold conditions were both true when that candle closed.
  • The gray line is the mean price often drifts back toward. The red line is where the stretch begins.
  • On the current (unfinished) candle the triangle can appear and disappear. Wait for the candle to close, especially on weekly.
  • A BUY is not always the exact low. Signals can stack for a few weeks and price can still push lower. See "Can it still make new lows?" below.
Can it still make new lows?

Yes. Moons Bottom flags an exhausted, stretched move. It does not call the exact low. Price can print a BUY, bounce a little, then push to a lower low and print more BUYs. That's why you often see signals stacked in a row on the charts above. On the Bitcoin chart, the BUYs in mid-2022 came before price made a lower low later that year.

When that lower low happens it normally comes with a weekly bullish divergence.

  • What it is: price makes a lower low, but RSI makes a higher low. Price is falling harder than the momentum behind it, so the sellers are running out of strength.
  • Why it matters: the red line and RSI tell you the move is stretched. The divergence tells you the new low is being made on weaker selling, which is the kind of low that tends to hold.
  • How to check: add TradingView's built-in RSI on the weekly chart. Compare the RSI low at the first BUY with the RSI low at the new price low. If price is lower and RSI is higher, that's the bull div.
  • What to expect: a new low after a BUY is normal, not a failed signal. Moons Bottom doesn't draw divergence itself, and a divergence doesn't guarantee a bottom either.
Settings
Baseline EMAAverage price is measured from. Default 20.
ATR LengthCandles used to measure normal volatility. Default 10.
Keltner MultiplierATRs below the EMA for the red line. Higher means fewer, more extreme signals. Default 2.0.
RSI LengthSpeed of the momentum reading. Default 7.
RSI OversoldLevel the smoothed RSI must fall below. Default 25.
Get the code
  1. Press Copy code.
  2. On tradingview.com, open a chart and click Pine Editor at the bottom.
  3. Delete what's there, paste, click Save, then Add to chart.
  4. Switch the chart to the 1W timeframe.
moons_bottom_v6.pinePine Script v6

Moon Cycle Reclaim

Overlay Pine v5 Weekly (1W) Alts, growth stocks, small caps

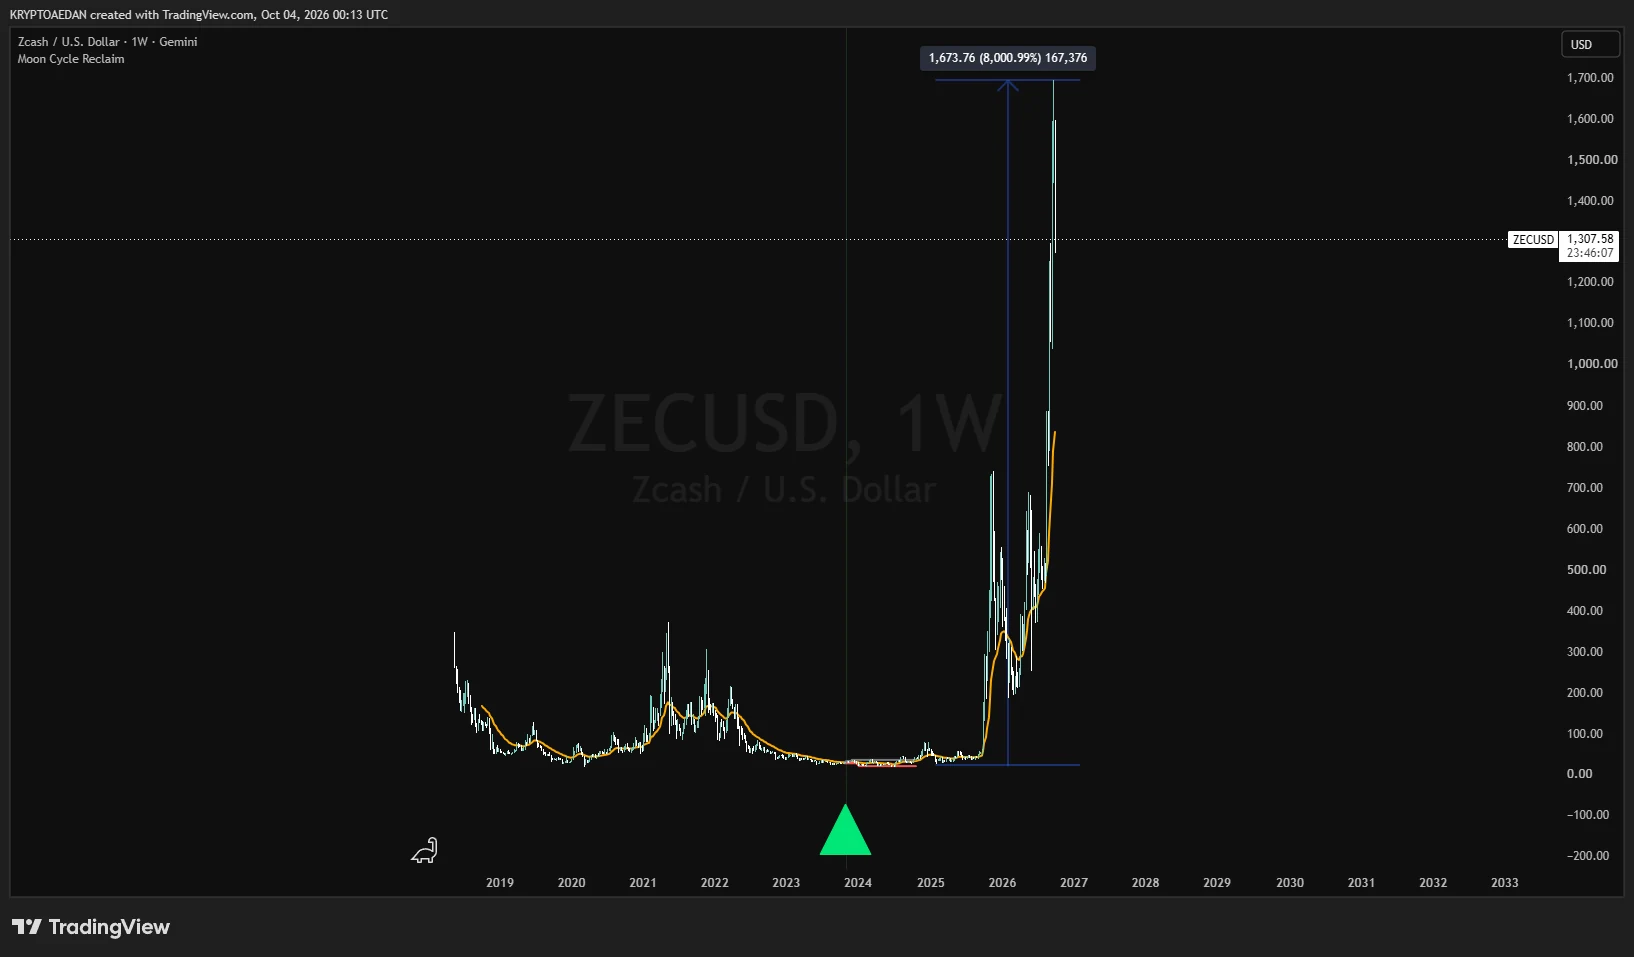
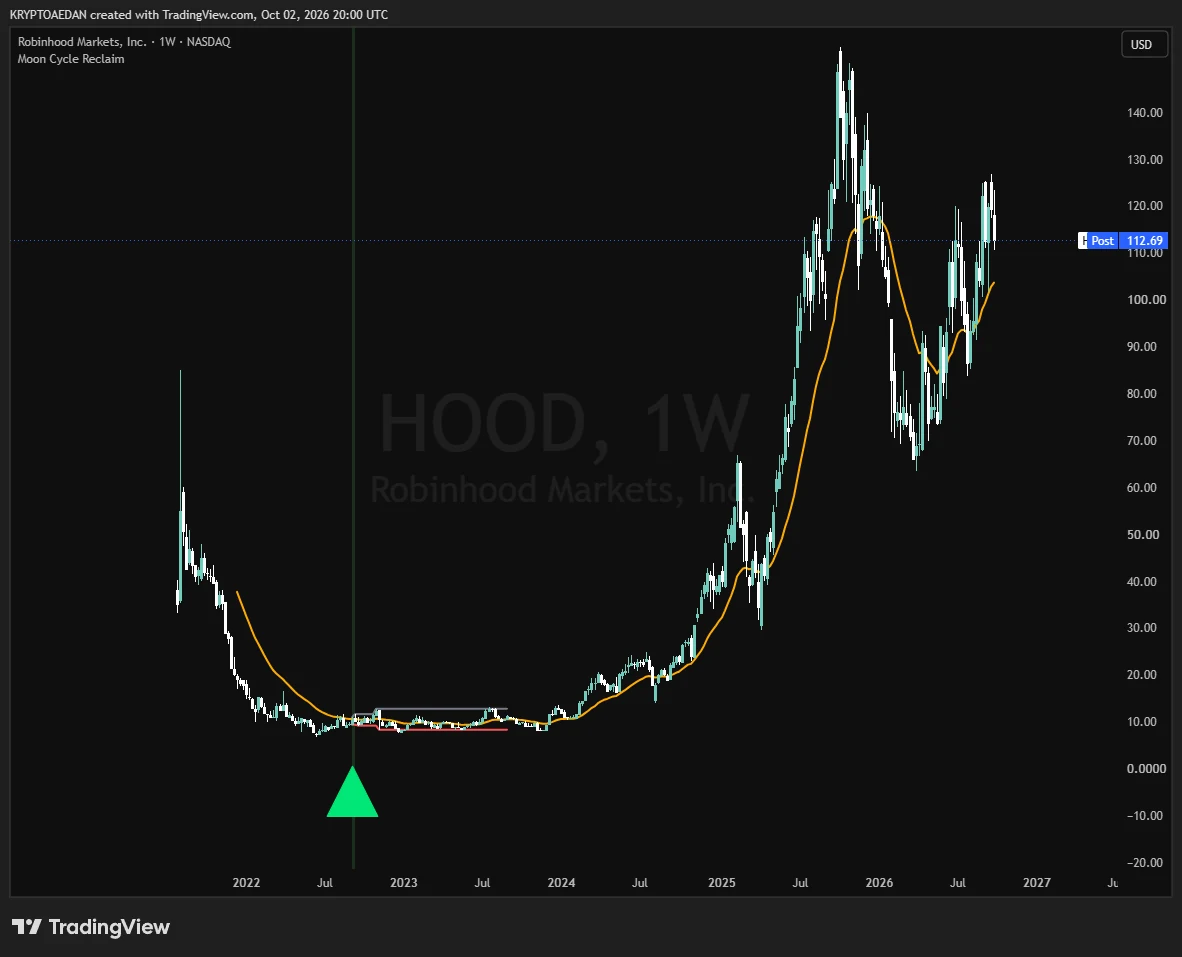
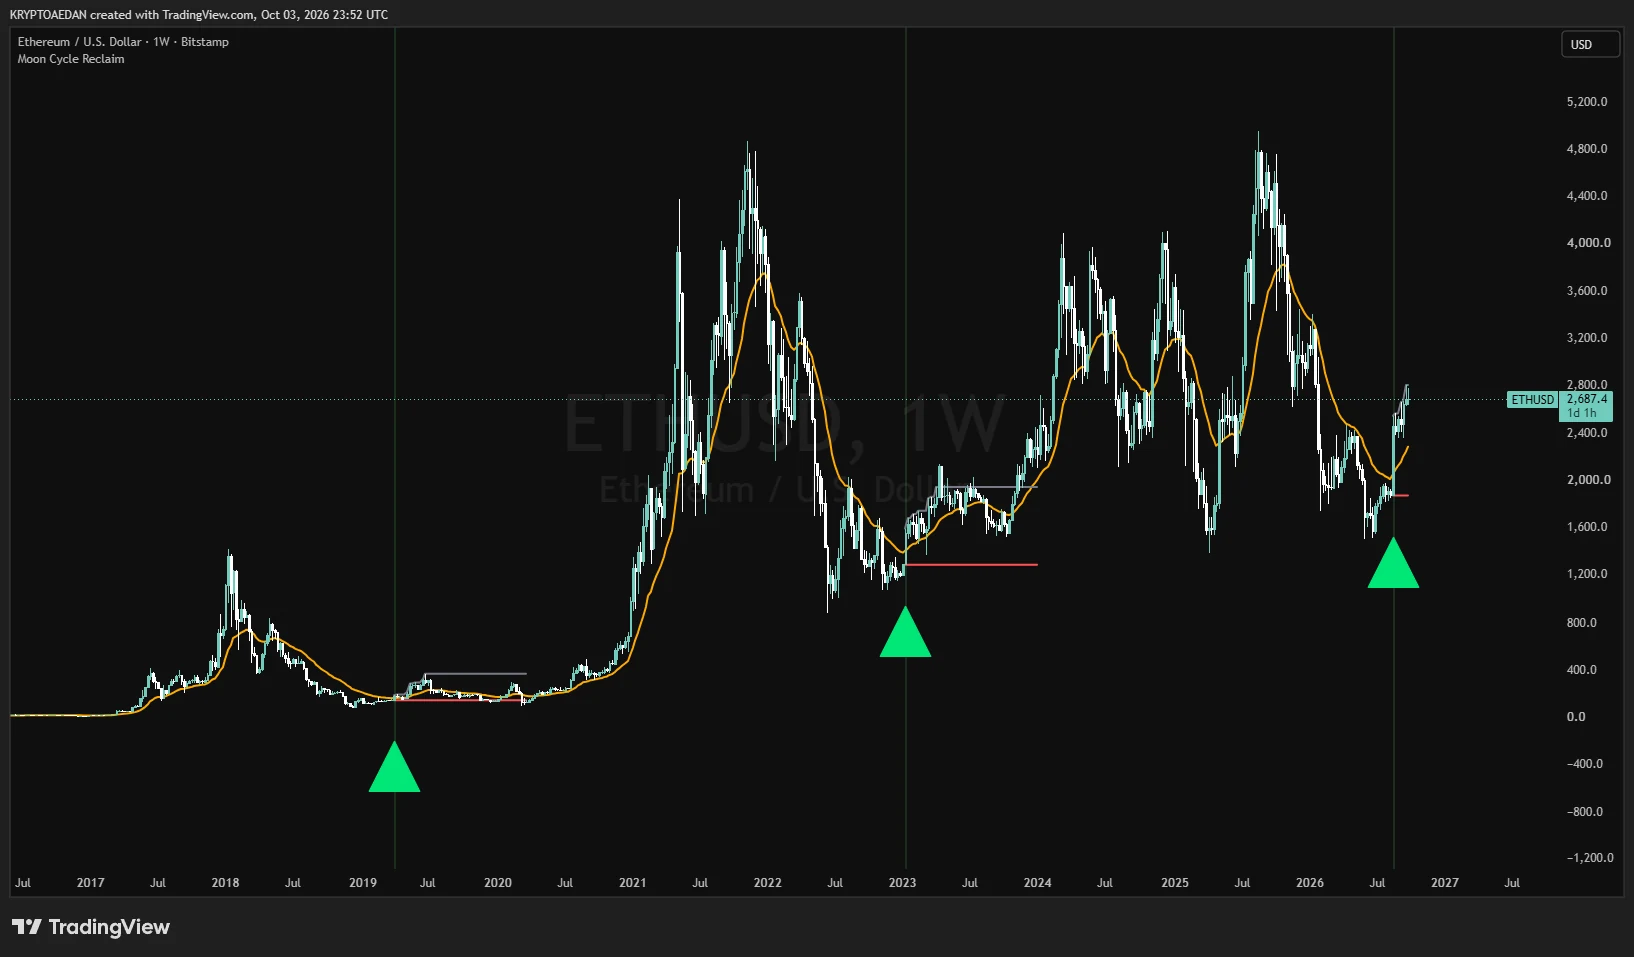
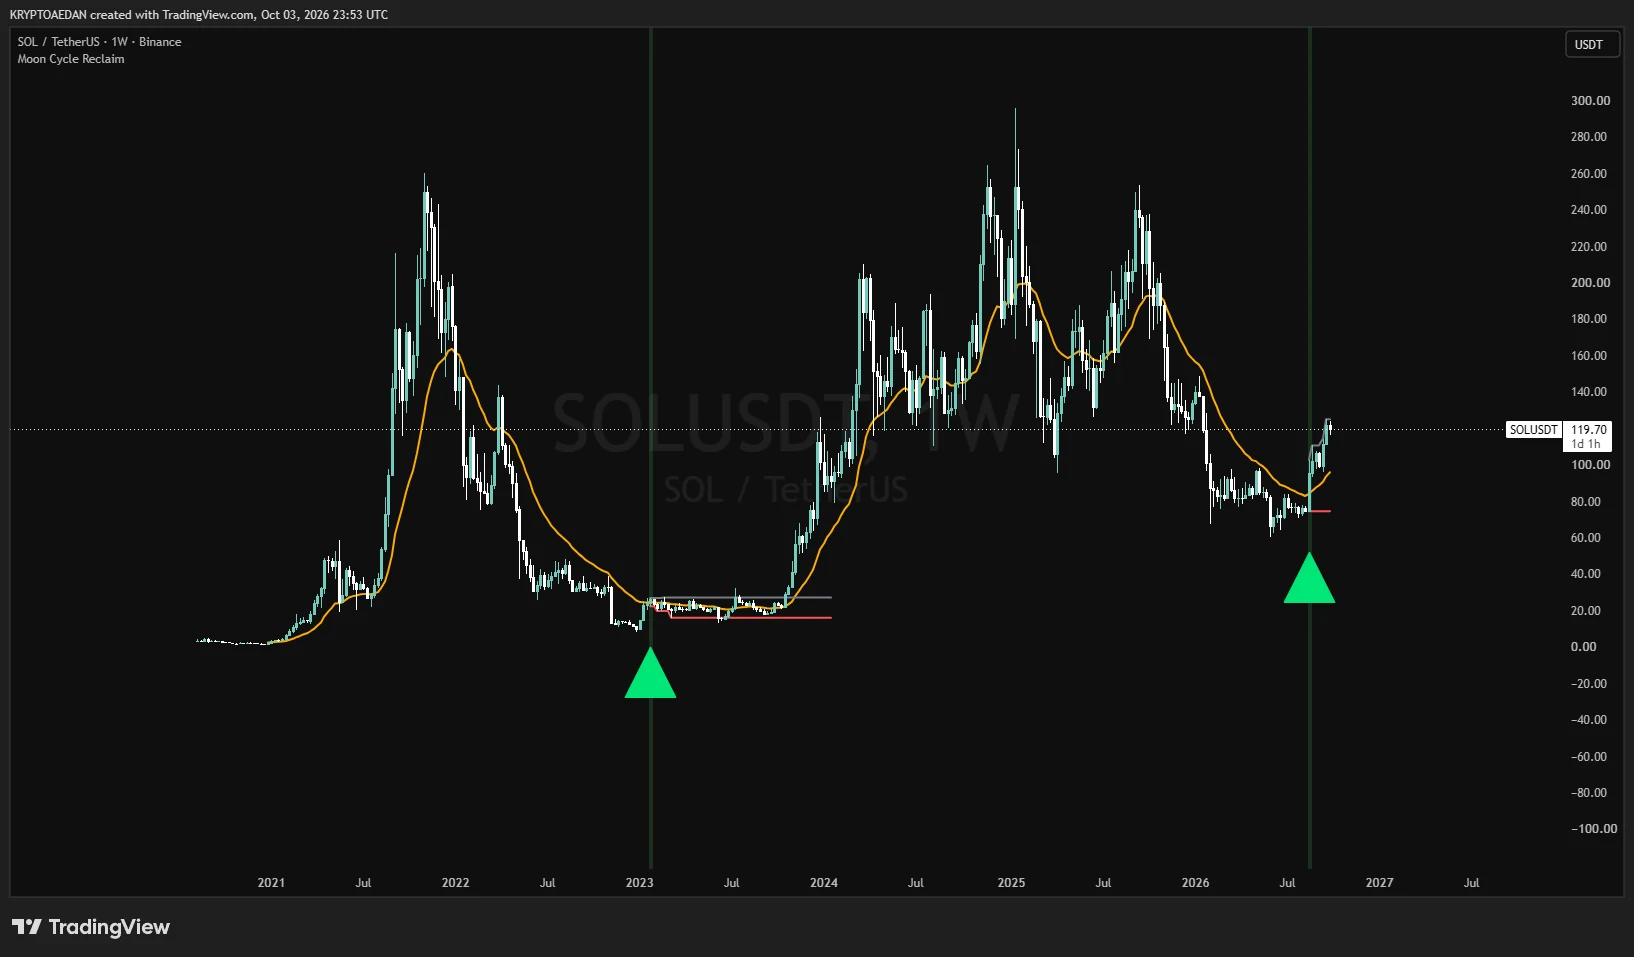
Marks the first weekly close back above the 21 EMA after a long bear bleed, then maps the sideways accumulation range that usually follows.

+8,000%
Zcash (ZEC), about $21 to about $1,695. One weekly reclaim, a long sideways base, then the run. Measured from the range low to the peak high on the chart. That is the best case with perfect timing, not what a typical entry would capture, and it is one of the strongest examples here. Not a promise of future results.
Open TradingView
The idea

High-beta altcoins, tech growth stocks and speculative small-caps tend to go through huge expansion phases followed by long, severe bleeds below the weekly 21 EMA.

  • The cycle: a massive run-up, then months of grinding lower with price living under the 21 EMA.
  • The structural reclaim: the first weekly close back above the 21 EMA after an extended bear phase suggests the vertical selling pressure is exhausted and the macro trend is shifting.
  • The base: the first break rarely launches into an instant V-bottom. It usually marks the start of a multi-month sideways range, where supply gets absorbed, final lower sweeps can happen, and the launchpad for the next macro leg is built.
What it does
  • Tracks bear bleed duration: counts the consecutive weeks spent below the 21 EMA, so routine pullbacks are filtered out and only true macro capitulation setups count.
  • Filters noise: fires once, on the first weekly reclaim after a long drawdown, so you don't get false breakout alerts on bounces in the middle of a trend.
  • Plots accumulation boundaries: automatically draws the high (resistance) and low (bottom floor) of the sideways range after the reclaim.
How to read it
  • Orange line: the 21 EMA.
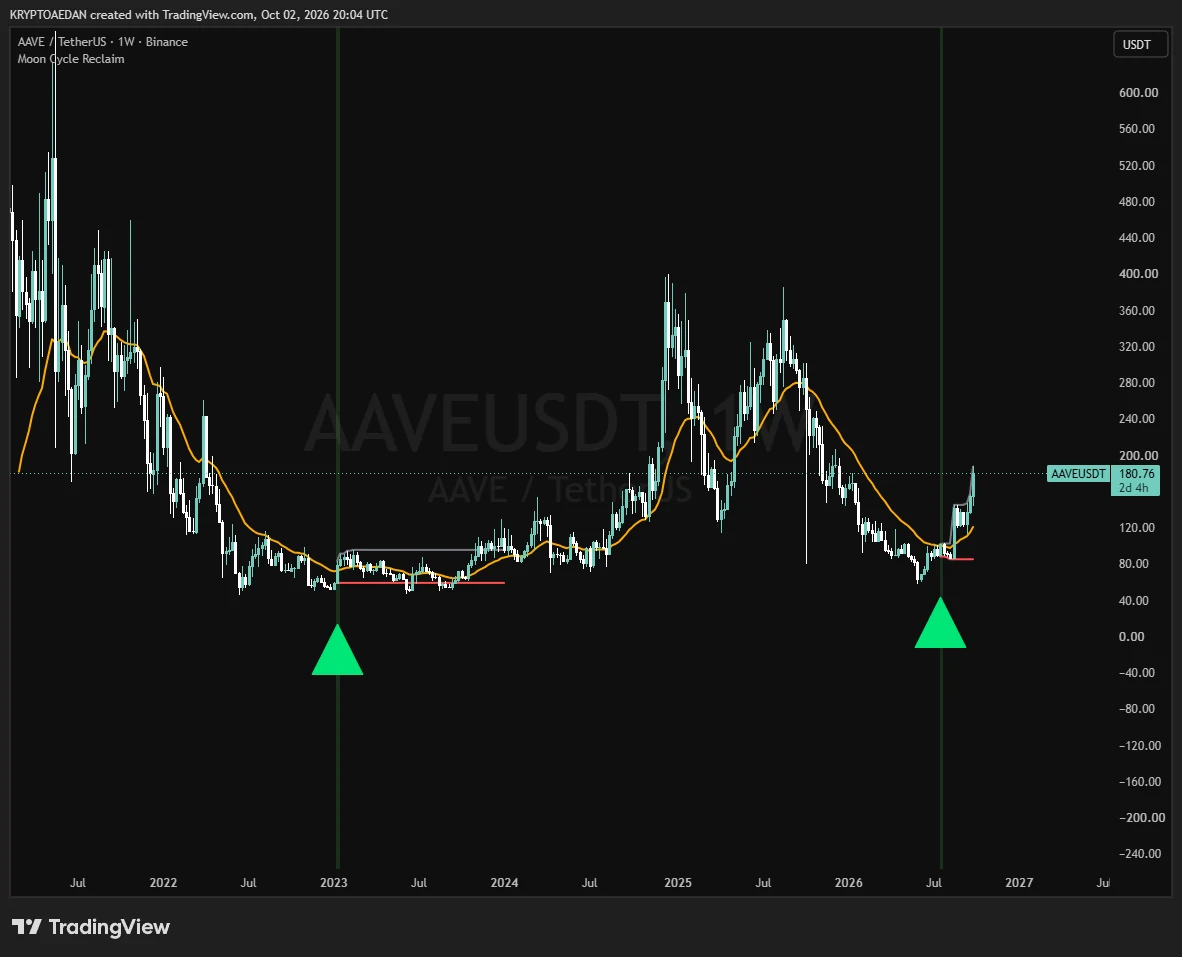
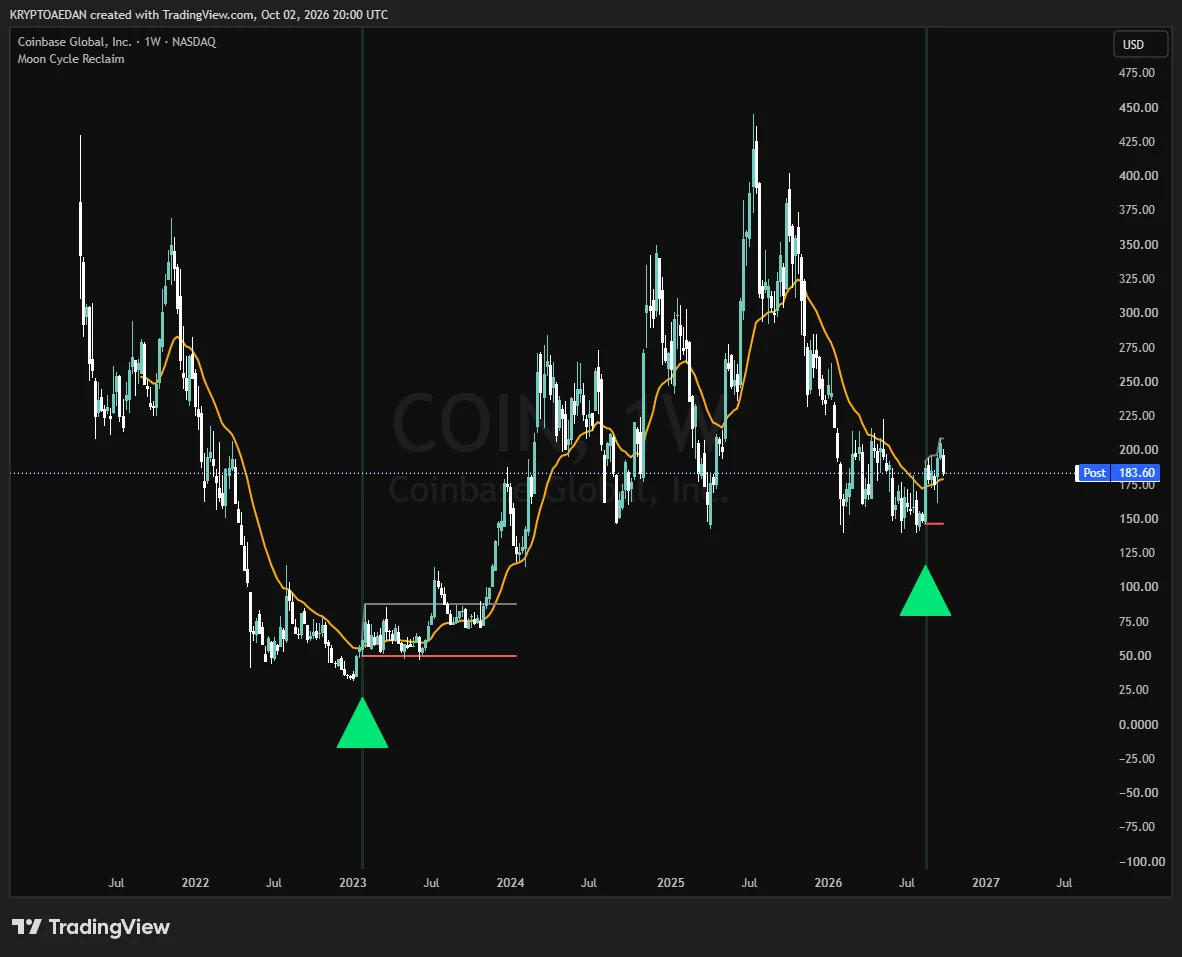
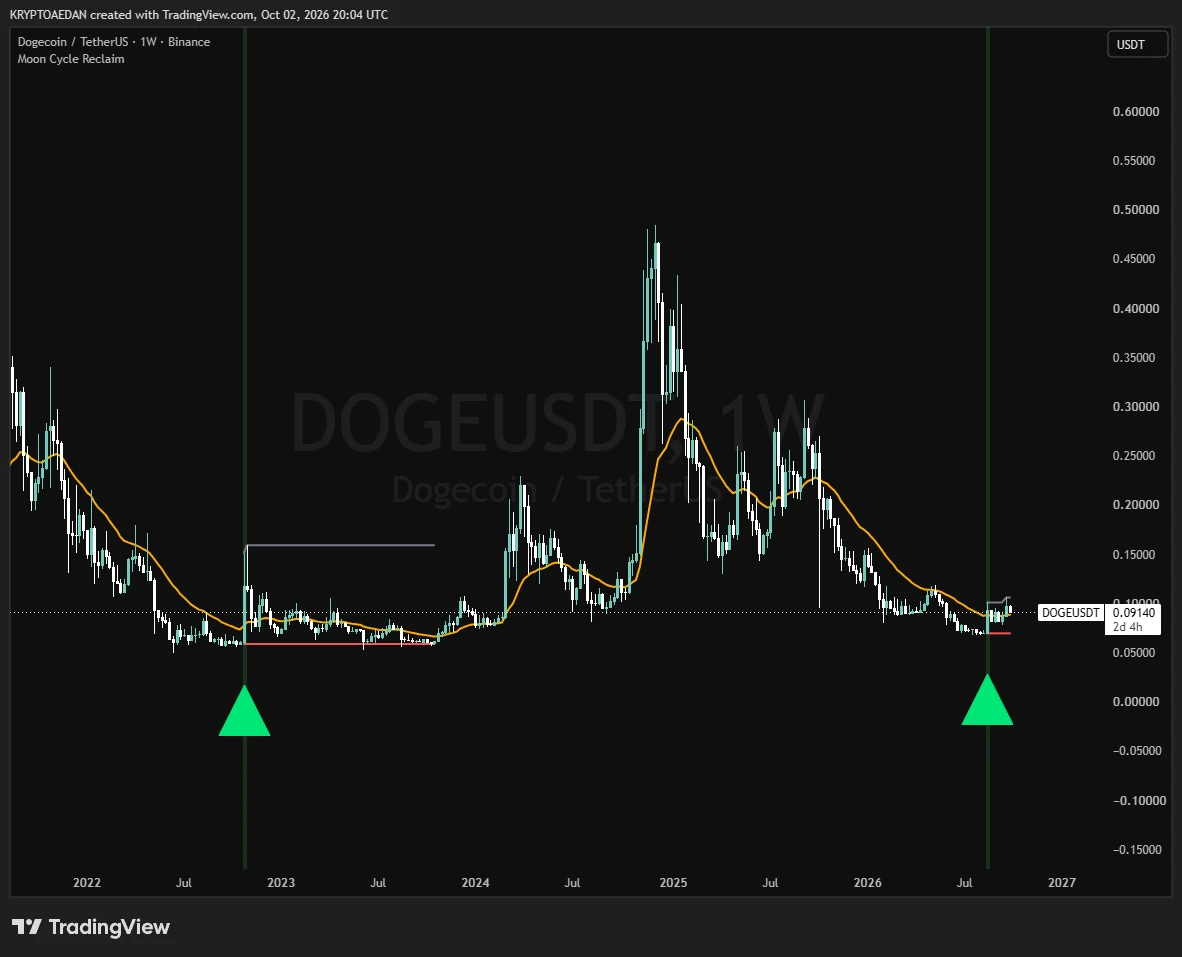
  • Green triangle and shaded candle: the first weekly close above the 21 EMA after at least the minimum number of weeks below it. It only fires once per long bleed.
  • Gray line and red line: the accumulation range. The high and low start at the signal candle and keep expanding for the first 12 weeks, then they freeze. The lines stay on the chart for 52 weeks.
  • What to expect after the signal: a sideways base, not an instant vertical move. Price can sweep the lows inside the range before the next leg.
  • Use it on the 1W chart. On other timeframes the "weeks" count becomes the number of candles.
  • A reclaim is a shift in structure, not a guarantee. Price can fall back below the 21 EMA.
A range, not the exact bottom

This indicator doesn't try to pick the exact low. The signal confirms the first weekly close back above the 21 EMA after a long bleed. On the charts above, that often came a little after the lowest point, and what followed was usually a sideways range, not a straight-up move.

  • Expect a base: the gray line (range high) and red line (range low) frame the zone where price chops around for months. Dogecoin and Robinhood both spent about a year in one.
  • Why that helps: you don't need to guess the bottom. You have a defined area and a clear floor, so you can build a position gradually across the range instead of all at once, with less pressure to catch one perfect entry.
  • The red line is your reference: a base that holds above it is doing its job. A weekly close that breaks well below it is a sign the base is failing, so you know where your idea is wrong.
  • Lower sweeps happen: price can dip toward or briefly under the lows inside the range before the next leg. That's normal behavior for accumulation, but it's also why position size matters.

This is a way to read the chart, not advice. A reclaim doesn't guarantee the next macro leg, and the 2026 signals on the charts are recent, so those ranges are still playing out.

Settings and tuning
EMA LengthThe moving average to reclaim. Default 21.
Min Weeks Below EMAWeeks price must spend below the EMA before a reclaim counts. Default 35.
Plot Accumulation Range BoxShow or hide the range high and low lines.

Suggested Min Weeks Below EMA by asset type

Crypto altcoins35 to 45 weeks. Fast, aggressive washout cycles.
High-beta growth stocks35 to 50 weeks. Longer drawdowns across rate and market cycles.
Large-cap tech and equities20 to 30 weeks. Shorter suppression before a reclaim.

Alert included: First 21 EMA Reclaim After Bear Bleed. Create it from the chart's alert menu.

Get the code
  1. Press Copy code.
  2. On tradingview.com, open a chart and click Pine Editor at the bottom.
  3. Delete what's there, paste, click Save, then Add to chart.
  4. Switch the chart to the 1W timeframe.
moon_cycle_reclaim_v5.pinePine Script v5

Educational use only, not financial advice. Indicators are tools for reading charts and do not predict price. Past signals don't guarantee future results.